File:Biochar process breakdown.png: Difference between revisions
Jump to navigation
Jump to search
(bar chart comparison of slow pyrolysis vs fast vs gasification vs combustin. source: https://s3.us-west-2.amazonaws.com/wp2.cahnrs.wsu.edu/wp-content/uploads/sites/32/2021/11/Biomass2Biochar-Chapter11.pdf) |
(Jb uploaded a new version of File:Biochar process breakdown.png) |
(No difference)
| |
Revision as of 21:48, 25 April 2022
Summary
bar chart comparison of slow pyrolysis vs fast vs gasification vs combustin. source: https://s3.us-west-2.amazonaws.com/wp2.cahnrs.wsu.edu/wp-content/uploads/sites/32/2021/11/Biomass2Biochar-Chapter11.pdf
File history
Click on a date/time to view the file as it appeared at that time.
| Date/Time | Thumbnail | Dimensions | User | Comment | |
|---|---|---|---|---|---|
| current | 14:26, 26 April 2022 |  | 471 × 420 (42 KB) | Jb (talk | contribs) | Reverted to version as of 17:48, 25 April 2022 (EDT) |
| 22:15, 25 April 2022 |  | 368 × 337 (29 KB) | Jb (talk | contribs) | same as above | |
| 21:48, 25 April 2022 | 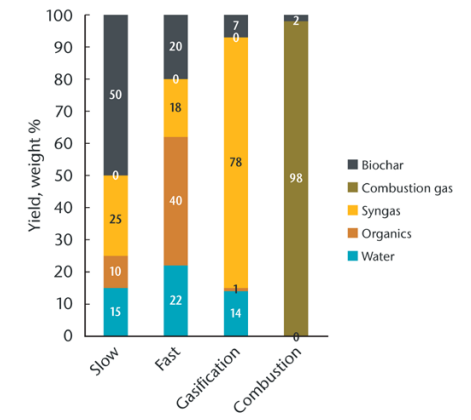 | 471 × 420 (42 KB) | Jb (talk | contribs) | reduced size to fit better on page | |
| 21:45, 25 April 2022 | 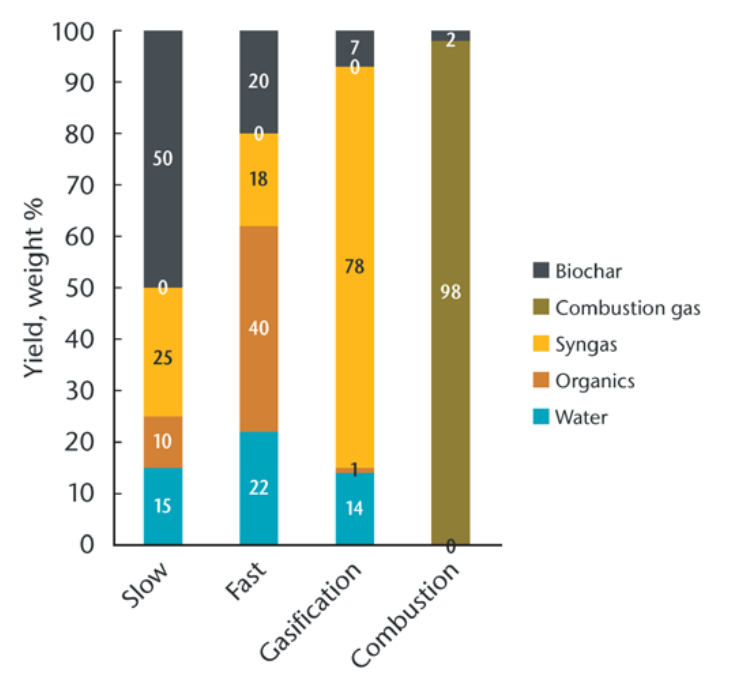 | 730 × 679 (86 KB) | Jb (talk | contribs) | bar chart comparison of slow pyrolysis vs fast vs gasification vs combustin. source: https://s3.us-west-2.amazonaws.com/wp2.cahnrs.wsu.edu/wp-content/uploads/sites/32/2021/11/Biomass2Biochar-Chapter11.pdf |
You cannot overwrite this file.
File usage
The following page uses this file: