Industrial Agriculture

Industrial agriculture is a system of uniformity with no diversity: massive acres of land covered in identical nearly artificial plants; fed artificial nitrogen, potassium, and phosphorus; sprayed with toxic pesticides, insecticides and herbicides. In Who Really Feeds The World, Dr. Vandana Shiva explains how “an ecologically destructive and nutritionally inefficient food system has become the dominant paradigm in our minds and the most touted practice on our lands, even though, in reality, small, biodiverse farms working with nature’s processes produce most of the food we eat.”
Indigenous Persons across Turtle Island have long utilized place-based regenerative agriculture techniques. Placed-based regenerative agriculture is predicated around the reality of humans being but one part in the web of life, and understanding our role as stewards to the environment.
Fully comprehending our stewardship role on Earth is vital to reversing the destructive effects of industrialized society and agriculture. Anything short of fully embracing this role (which we all must fulfill) will have long lasting devastating effects for us, future generations, and all other life on Earth.[2]
Mono-Cultures
The US Farm Bill, the major legislation that encompasses agriculture, conservation, and research and food assistance programs, has, over its various iterations and re-authorizations, incentivized monoculture production, primarily corn and soybean. Its major objective is to stabilize prices and incomes, not to protect environmental interests. This massively expensive legislation guides all aspects of the US food and farming systems, but is heavily influenced by special interests, and thus its policies have favored consolidated large-scale farms, and grains over fruits and vegetables, heavy use of chemical fertilizers, among other incentives to maximize profits over environmental stewardship.[3]
Because of these shifts and other policy- or economic-related factors, most of the grain grown in US is not used directly for food. It is fed to animals in feedlots (about 36%), used for biofuels (about 40%), exported (about 10%), and used in high-fructose corn syrup and other food products (a few %; Foley 2013; Barton and Clark 2014). Of the total acreage in corn, about 5%, or 2 million ha, is needed just to support the supply of chicken and pork sold at McDonalds and Walmart. Only ~ 1% of all corn grown is directly eaten by people as “sweet corn”. The mandate for ethanol production in the US, originally intended to support farmers and reduce foreign dependence on oil, has resulted in 12.5 million ha of corn dedicated to ethanol corn (equivalent to more than all the crop land in Iowa) and likely has contributed to an increase in N fertilizer use in the past 2 decades. In the 1990s, the US produced about 10 million MT of corn for biofuels; in 2018 it was ~ 140 million MT, about 12-fold more than that used for high fructose corn syrup.[4]
CAFOS
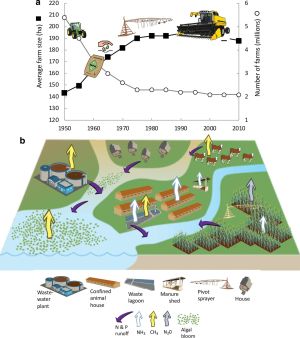
CAFOS are 'Confined Animal Feeding Operations' and have increased, in the US, by 10% between 2012 and 2020. Hog production increased by 13 percent during the same time frame. There are ~8.7 billion animals in CAFO operations- animals include: Cattle, Dairy Cows, Hogs, Broiler Chickens, and Turkeys. The areas where animals are farmed is concentrated regionally across the country.[5]
The waste from hog and dairy operations is mainly held in open lagoons that contribute to NH3 and greenhouse gas (as CH4 and N2O) emissions. Emissions of NH3 from animal waste in 2019 were estimated at > 4,500,000 MT. Emissions of CH4 from manure management increased 66% from 1990 to 2017 (that from dairy increased 134%, cattle 9.6%, hogs 29% and poultry 3%), while those of N2O increased 34% over the same time period (dairy 15%, cattle 46%, hogs 58%, and poultry 14%).[6]
Artificial Fertilizers
Commercial artificial fertilizers are ubiquitously used across the so-called United States- with nitrogen (N) exceeding 12 million metric tonnes (MT) and is increasing annually at a rate of 60 thousand MT per year. Phosphorus (P) has remained constant for the last decade being used at a rate of 1.8 million MT per year.[7] Nitrogen applied by fertilizer is about 3 times greater than manure Nitrogen inputs and manure Phosphorus inputs are about equivalent to artificial Phosphorus inputs.[8]
Dead Zones

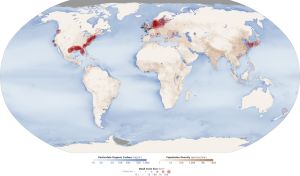
"'Dead zone' is a more common term for hypoxia, which refers to a reduced level of oxygen in the water. ... Less oxygen dissolved in the water is often referred to as a “dead zone” because most marine life either dies, or, if they are mobile such as fish, leave the area. Habitats that would normally be teeming with life become, essentially, biological deserts. "[10]
The negative effects of hypoxia include loss of suitable and required habitat for many bottom-dwelling fishes and benthic fauna, habitat compression for pelagic fishes, direct mortality, increased predation, decreased food resources, altered trophic energy transfer, altered bioenergetics (physiological, development, growth, and reproductive abnormalities) and altered migration. These result in reduced fisheries, including valuable finfishes and crustaceans. Increasing nutrient loads that also change the nutrient ratios can affect the composition of the phytoplankton community and can shift trophic interactions. Hypoxia also alters or interrupts ecosystem functions and services such as nutrient cycling and bioturbation.[11]
Dead zones across the world increase with humanity's growing dependency on chemical fertilizers for crops. Additionally, Global climate collapse has a high likelihood of worsening existing hypoxia zones and facilitating its formation in additional waters.[12] In 1995 there were 195 documented areas of human-caused hypoxia and by 2008 Diaz and Rosenberg[13] documented over 400 cases of hypoxia in the world's coastal ocean which covered more than 245,000 km2 of sea bottom.[14]
The corn-belt (mainly encompassing Illinois, Indiana, Iowa, Missouri, and Ohio) of the so-called United States uses more than 4.5 million metric tonnes (MT) of chemically manufactured Nitrogen and uses more than one million MT of manure produced Nitrogen. The Nitrogen is mainly used to fertilize soy bean and corn crops and is considered to be the main source of Nitrogen causing the Gulf of Mexico dead zone.[15][16]
Sources to begin with:
https://www.sciencedirect.com/science/article/abs/pii/S2212613914000373?via%3Dihub
https://academic.oup.com/icesjms/article/66/7/1528/656749
Climate Collapse
Land-Use Change
Corporations
See: Bayer-Monsanto | Syngenta | General Mills | Silicon Ranch Corporation
Sources
- ↑ Glibert, P.M. From hogs to HABs: impacts of industrial farming in the US on nitrogen and phosphorus and greenhouse gas pollution. Biogeochemistry 150, 139–180 (2020). https://doi.org/10.1007/s10533-020-00691-6
- ↑ https://branchoutnow.org/growing-sovereignty-turtle-island-and-the-future-of-food/
- ↑ Glibert, P.M. From hogs to HABs: impacts of industrial farming in the US on nitrogen and phosphorus and greenhouse gas pollution. Biogeochemistry 150, 139–180 (2020). https://doi.org/10.1007/s10533-020-00691-6
- ↑ Glibert, P.M. From hogs to HABs: impacts of industrial farming in the US on nitrogen and phosphorus and greenhouse gas pollution. Biogeochemistry 150, 139–180 (2020). https://doi.org/10.1007/s10533-020-00691-6
- ↑ Glibert, P.M. From hogs to HABs: impacts of industrial farming in the US on nitrogen and phosphorus and greenhouse gas pollution. Biogeochemistry 150, 139–180 (2020). https://doi.org/10.1007/s10533-020-00691-6
- ↑ Glibert, P.M. From hogs to HABs: impacts of industrial farming in the US on nitrogen and phosphorus and greenhouse gas pollution. Biogeochemistry 150, 139–180 (2020). https://doi.org/10.1007/s10533-020-00691-6
- ↑ Glibert, P.M. From hogs to HABs: impacts of industrial farming in the US on nitrogen and phosphorus and greenhouse gas pollution. Biogeochemistry 150, 139–180 (2020). https://doi.org/10.1007/s10533-020-00691-6
- ↑ Glibert, P.M. From hogs to HABs: impacts of industrial farming in the US on nitrogen and phosphorus and greenhouse gas pollution. Biogeochemistry 150, 139–180 (2020). https://doi.org/10.1007/s10533-020-00691-6
- ↑ https://earthobservatory.nasa.gov/images/44677/aquatic-dead-zones
- ↑ https://oceanservice.noaa.gov/facts/deadzone.html
- ↑ Rabalais, N. N., Díaz, R. J., Levin, L. A., Turner, R. E., Gilbert, D., and Zhang, J.: Dynamics and distribution of natural and human-caused hypoxia, Biogeosciences, 7, 585–619, https://doi.org/10.5194/bg-7-585-2010, 2010.
- ↑ Rabalais, N. N., Díaz, R. J., Levin, L. A., Turner, R. E., Gilbert, D., and Zhang, J.: Dynamics and distribution of natural and human-caused hypoxia, Biogeosciences, 7, 585–619, https://doi.org/10.5194/bg-7-585-2010, 2010.
- ↑ Robert J. Diaz Rutger Rosenberg, Spreading Dead Zones and Consequences for Marine Ecosystems. Science321,926-929(2008).DOI:10.1126/science.1156401
- ↑ Rabalais, N. N., Díaz, R. J., Levin, L. A., Turner, R. E., Gilbert, D., and Zhang, J.: Dynamics and distribution of natural and human-caused hypoxia, Biogeosciences, 7, 585–619, https://doi.org/10.5194/bg-7-585-2010, 2010.
- ↑ Glibert, P.M. From hogs to HABs: impacts of industrial farming in the US on nitrogen and phosphorus and greenhouse gas pollution. Biogeochemistry 150, 139–180 (2020). https://doi.org/10.1007/s10533-020-00691-6
- ↑ Turner, R. E., Rabalais, N. N., & Justic, D. (2006). Predicting summer hypoxia in the northern Gulf of Mexico: Riverine N, P, and Si loading. Marine Pollution Bulletin, 52(2), 139–148. doi:10.1016/j.marpolbul.2005.08.012